Solutions / Lacima Analytics / Market Risk
Value-at-Risk (VaR)
Don’t just calculate your Value-at-Risk (VaR) – understand it.
Your Value-at-Risk (VaR) Questions
Can I identify where my risk hotspots are across a diverse, complex portfolio?
How will potential stresses and scenarios affect my portfolio value and risk profile?
How do I understand how much my VaR is changing each day, and why?
How do I forecast how potential trades or other portfolio changes will affect risk?
How can I drill down into portfolio elements to better understand my risk drivers?
How can I produce accurate VaR reports efficiently?
How can we achieve a consolidated view of VaR across our different trading and risk systems and business units?
How can we reduce ‘key person risk’ of current in-house solutions?
Understanding the drivers of risk, and how they are evolving, is essential for Risk and Trading Managers. It’s vital to not just calculate VaR but to look beyond the numbers to truly understand it.
Our Value-at-Risk (VaR) Solution
Allows Risk and Trading Managers to better understand how potential trades may impact their risk profile and confidently explain daily changes to VaR, while comprehensive stress testing and scenario analysis functionality enables enhanced reporting to trading, risk, and senior management. Provides a consolidated view of exposures and VaR across an entire portfolio, regardless of the different ETRM systems employed.
Lacima Analytics > VaR helps you understand the story your risk data is telling you:
- Where your risk lies (VaR decomposition);
- Why it changed (VaR attribution); and
- What caused the change (VaR drilldown).
See beyond the numbers to understand the ‘where’, ‘why’ and ‘what’ of your risk story, with full visibility of the sources and drivers of risk in your portfolio.
Drill-down to report on your VaR in multiple dimensions.


The Value-at-Risk (VaR) Features
Integrate data outputs with a business reporting solution to:
See why your VaR has changed with VaR attribution dashboards.

Or decompose your VaR to identify what’s driving the changes.

- Supports multiple VaR methodologies including Parametric VaR, Historical VaR and Covariance Monte Carlo VaR
- Calculate price and value sensitivities with a range of customisable Greek analysis
- Gain deeper insights into your VaR composition with drill-down reporting in multiple dimensions including by commodity, geography, market, desk, strategy, trader, and contract
- Understand how individual positions contribute to VaR with incremental, marginal and component VaR reporting
- Audit past VaR calculations using original input data and model configuration
- Run stress testing and scenario analysis to model potential market prices, trades, positions and other parameters like volatilities and correlations
- Understand day-to-day changes to VaR and produce VaR attribution reports
- Implement user controls configuring user group access for viewing, adding and editing
- Consolidate your risk view across multiple deal capture systems
- Manage complex trades, portfolios, and structured deals other systems are unable to handle
- Integrate VaR into your own or 3rd party systems with Lacima’s API REST web services
Extend Your VaR Insights
Integrate data outputs from Lacima Analytics with the business intelligence tool of your choice to create powerful, interactive VaR dashboards, tailored to your specific analytics needs.
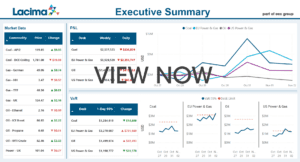
Watch as we demonstrate how to identify a VaR breach and drill down to uncover the cause using outputs from Lacima Analytics visualised in Microsoft PowerBI.
Or, explore the VaR dashboards pictured in the video for yourself here.
Related Solutions
Lacima Analytics > EaR
Calculate and manage your cashflow-based risk metrics including Earnings-at-Risk, Gross Margin-at-Risk, Revenue-at-Risk and Profit-at-Risk.
Lacima Analytics > P&L Attribution
Provide robust daily P&L Attributions for deep insights into what’s driving your profitability. Decompose your portfolio to understand where value is coming from and how it changes over time.


